Contractor Sales Funnel: How to Measure Every Stage and Fix the Bottleneck
Most contractors watch ad spend and sold jobs, and miss everything in between. Here's how to measure each stage from lead to closed job, find the bottleneck, and fix it one stage at a time.
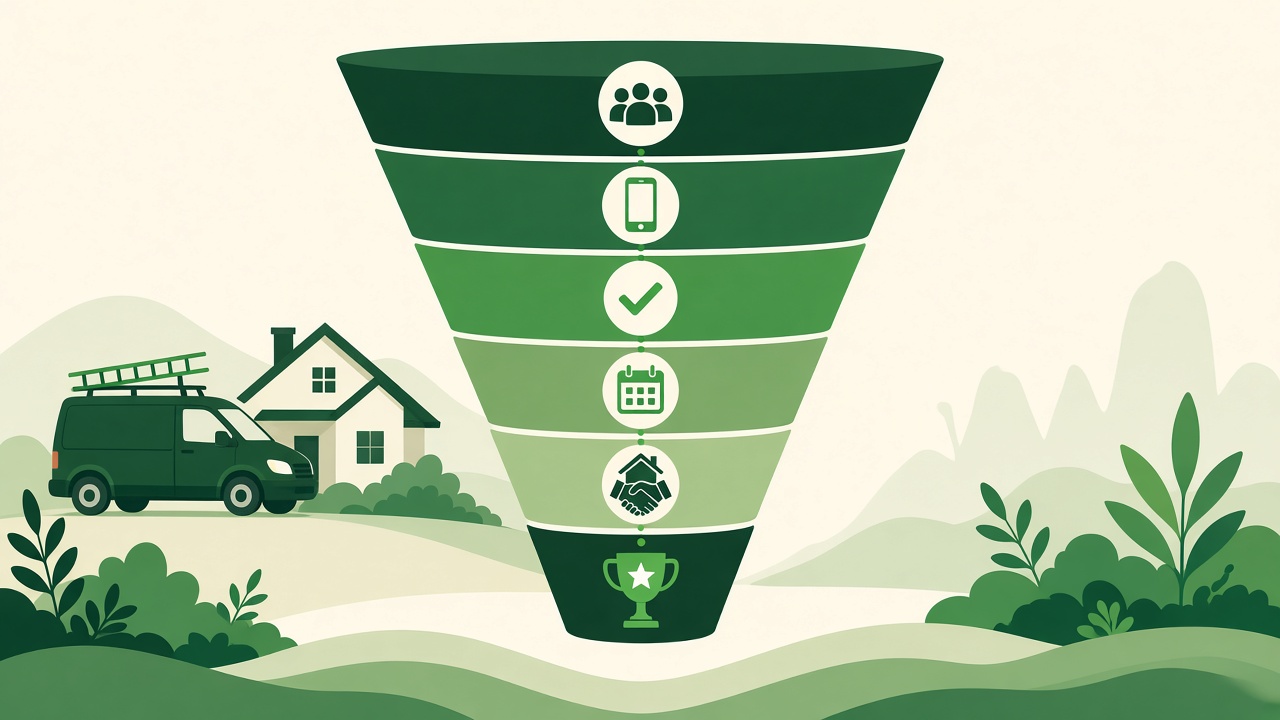
The short answer: A contractor sales funnel is the path from traffic to lead, qualified lead, scheduled appointment, appointment ran, and closed job. Count each stage every week. Divide each stage by the one before it to get a conversion rate. The stage with the worst rate compared with where it should be is your bottleneck. Fix that one first, give it an owner, and write down what worked.
Most owners only watch two numbers: how much they spent and how many jobs they sold. Everything that happens in between is where the money leaks. This post shows you how to see it.
Why most contractors can't find their bottleneck
"We need more leads" is the most common thing we hear. Sometimes it's true. Often it isn't.
If half your leads never get a call back, more leads just means more waste. If appointments get set but nobody shows up, more ad spend won't fix that either.
The research on lead handling shows how much leaks before a sales conversation even starts:
- A Harvard Business Review audit of 2,241 U.S. companies found 23% never responded to a web lead, and those that did reply within 30 days took 42 hours on average. (summary)
- InsideSales' 2021 study of 5.7 million inbound leads found conversion rates were 8 times higher when the first attempt came within 5 minutes than when it came between 5 minutes and 24 hours. (InsideSales)
You can't fix what you don't measure. So start with the stages.
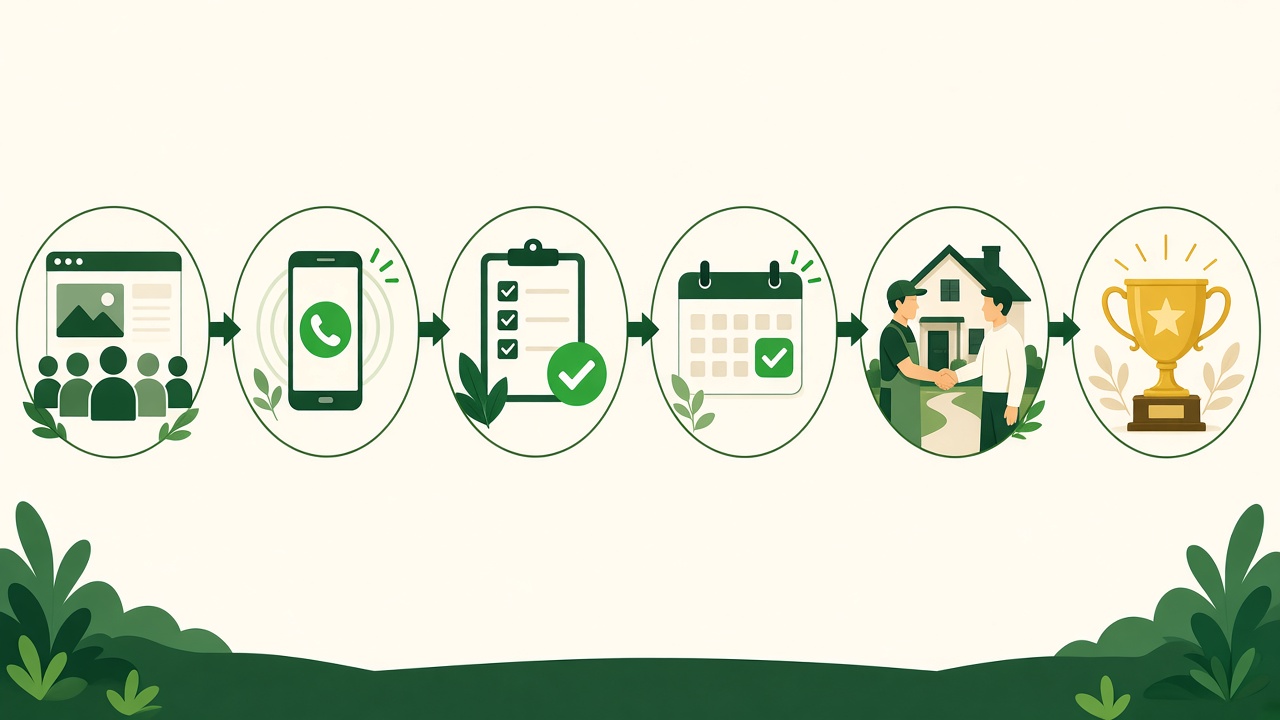
The six stages of a contractor sales funnel
Here's the funnel in plain terms. Each stage needs a clear rule for what counts, so everyone on your team counts the same way.
- Traffic: people who saw or visited you (website visits, Google Business Profile views, ad clicks).
- Lead: someone who called, texted or filled out a form with real contact info.
- Qualified lead: in your service area, needs work you do, and is ready to move in a reasonable time.
- Scheduled appointment: a confirmed date and time for an inspection, estimate or consult.
- Appointment ran: your rep or tech actually met the homeowner and saw the job.
- Closed and won: signed contract or deposit.
Write those definitions down. If one rep counts a voicemail as "contacted" and another doesn't, your numbers mean nothing.
What to track at each stage (with formulas)
Each rate is the next stage divided by the previous stage.
- Traffic to lead (count: leads). Lead rate = Leads ÷ Traffic
- Lead to qualified (count: qualified leads). Qualified rate = Qualified ÷ Leads
- Qualified to scheduled (count: appointments set). Booking rate = Scheduled ÷ Qualified
- Scheduled to ran (count: appointments that happened). Show rate = Ran ÷ Scheduled
- Ran to won (count: signed jobs). Close rate = Won ÷ Ran
Then track the money:
- Cost per lead = Ad spend ÷ Leads
- Cost per appointment ran = Ad spend ÷ Appointments ran
- Cost per job won = Ad spend ÷ Jobs won
- ROAS (return on ad spend) = Revenue from closed jobs ÷ Ad spend
Also track one speed number: time from lead to first contact. It sits between "lead" and "qualified" and affects everything below it.

A worked example (example numbers only)
These are made-up numbers to show the math. They are not benchmarks and not client results.
Say a roofing company spends $5,000 on ads in a month.
- Traffic: 4,000 visits
- Leads: 100 (lead rate = 100 ÷ 4,000 = 2.5%)
- Qualified: 60 (qualified rate = 60 ÷ 100 = 60%)
- Scheduled: 30 (booking rate = 30 ÷ 60 = 50%)
- Ran: 21 (show rate = 21 ÷ 30 = 70%)
- Won: 6 (close rate = 6 ÷ 21 = about 29%)
At an example average job of $12,000, that's $72,000 in revenue.
- Cost per lead: $5,000 ÷ 100 = $50
- Cost per job won: $5,000 ÷ 6 = about $833
- ROAS: $72,000 ÷ $5,000 = 14.4
Now find the leak. Half of qualified leads never get booked. If better follow-up raised the booking rate from 50% to 65%, you'd have about 39 appointments instead of 30. At the same show and close rates, that's roughly 8 jobs instead of 6, with the same ad spend.
That's the point. The cheapest growth is usually inside the funnel you already have.
How to find the bottleneck
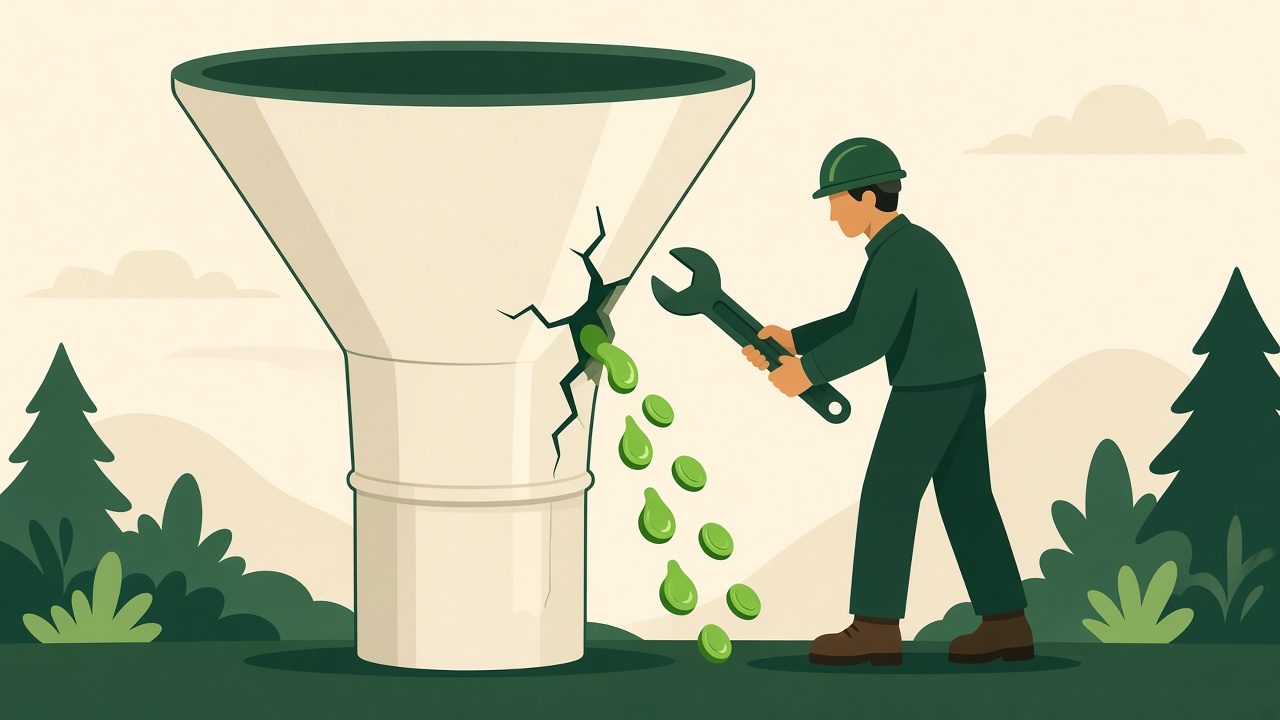
Use this process every week.
- Pull the counts for each stage for the same time period.
- Calculate each stage's rate.
- Compare each rate with your own past numbers, not someone else's blog post. Your market, trade and lead sources are different.
- Pick the one stage that dropped the most or sits furthest below your normal.
- Ask why. Listen to calls, read texts, check how fast leads were contacted.
- Fix that one stage. Leave the rest alone for now.
Split your numbers by lead source when you can. Google, Meta, referrals and your Google Business Profile often behave very differently. A blended number hides the problem.
Fixes by stage, mapped to Attract, Capture, Book, Improve
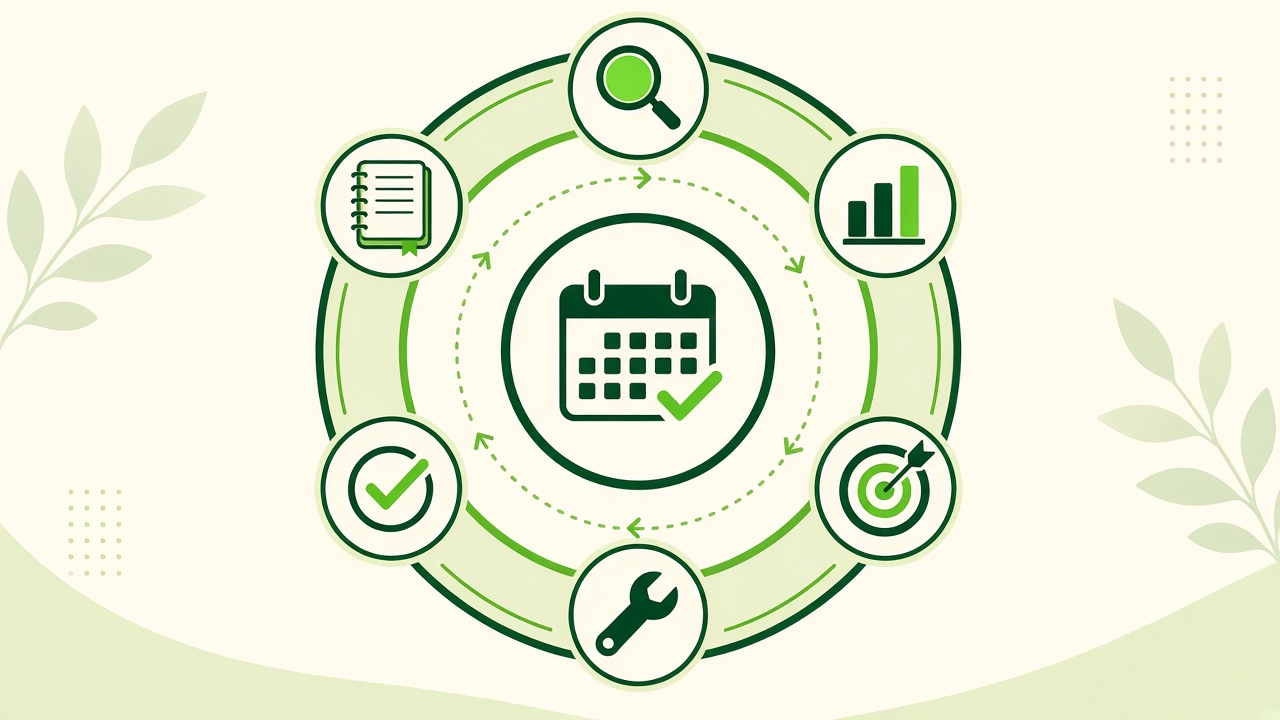
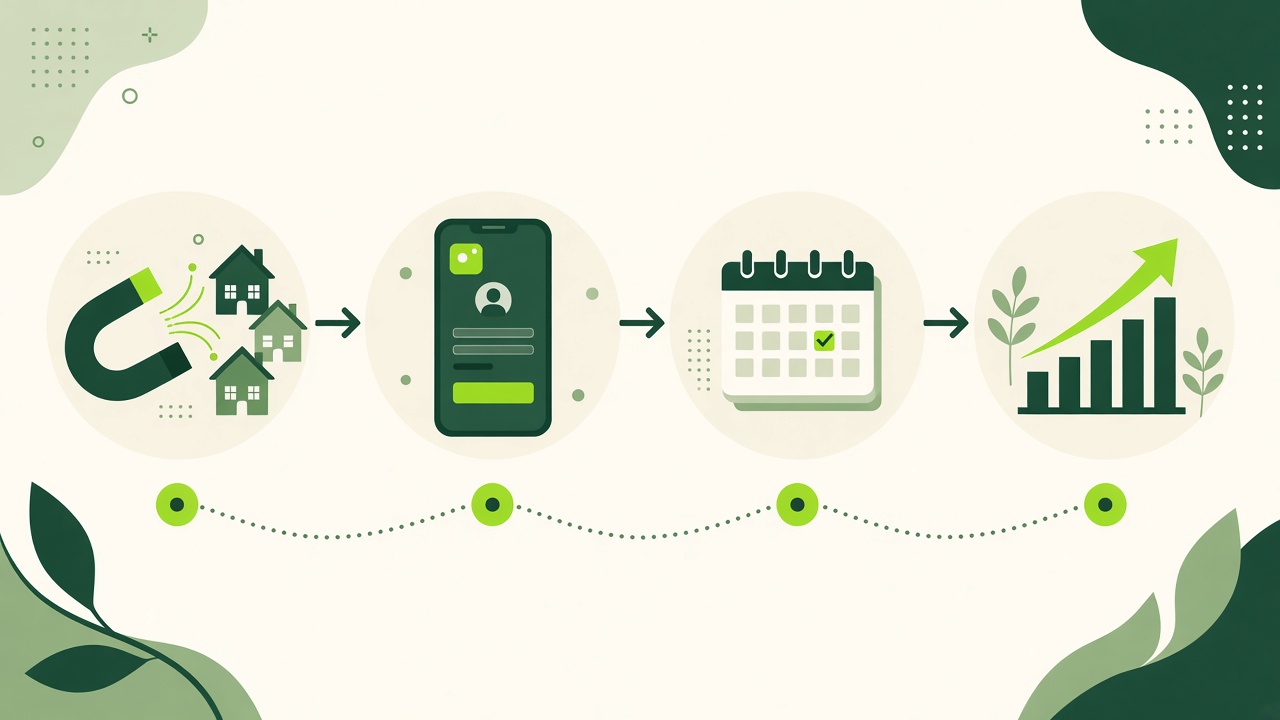
At Able To Do we organize this work around four steps: Attract, Capture, Book, Improve. It covers our services for roofing, solar, HVAC, plumbing and remodeling companies. Here's what usually fixes each stage.
Low traffic (Attract)
Not enough of the right people are finding you.
- Tighten your Google Business Profile: correct categories, real service areas, photos and recent reviews. See our Google Business Profile guide for plumbers; the same steps apply to other trades.
- Run Google and Meta ads aimed at your real service area and best jobs, not broad clicks.
Reviews matter here. BrightLocal's 2026 survey found 47% of consumers won't use a business with fewer than 20 reviews. (BrightLocal)
Low lead rate (Capture)
People visit but don't reach out.
- Make the offer clear: what you do, where, and why you're the safe choice.
- Put click-to-call and a short form above the fold.
- Show proof: reviews, licenses, real job photos.
Low qualified rate (Capture)
You get leads, but many are junk or out of area.
- Tighten ad targeting and service-area settings.
- Add one or two qualifying questions to forms (ZIP code, type of job).
- Make your ad copy say who you serve and what you don't do.
Low booking rate (Book)
Good leads aren't turning into appointments. This is the most common leak.
- Respond within minutes. Set up a missed-call text-back. Here are scripts you can copy.
- Use a follow-up cadence: same day, day 1, day 3, day 7.
- Give one person ownership of booking, with a backup.
Low show rate (Book)
Appointments get set, but nobody's home.
- Send confirmation and reminder texts the day before and the morning of.
- Confirm the decision-makers will be there.
- Make rescheduling easy instead of letting it turn into a no-show.
Low close rate (Book and Improve)
Appointments run, but jobs don't close.
- Review what happens in the home: presentation, pricing clarity, financing options.
- Follow up on every open estimate. One email and silence isn't follow-up.
- Log the reason for every lost deal.
Make it stick: ownership, process, scorecard
Numbers only help if someone acts on them. This is how we run it as a fractional CMO function:
- Clarify the offer. Know what you sell, to whom, and why they should pick you.
- Measure the funnel. Leads, qualified, scheduled, ran, won, and ROAS, every week.
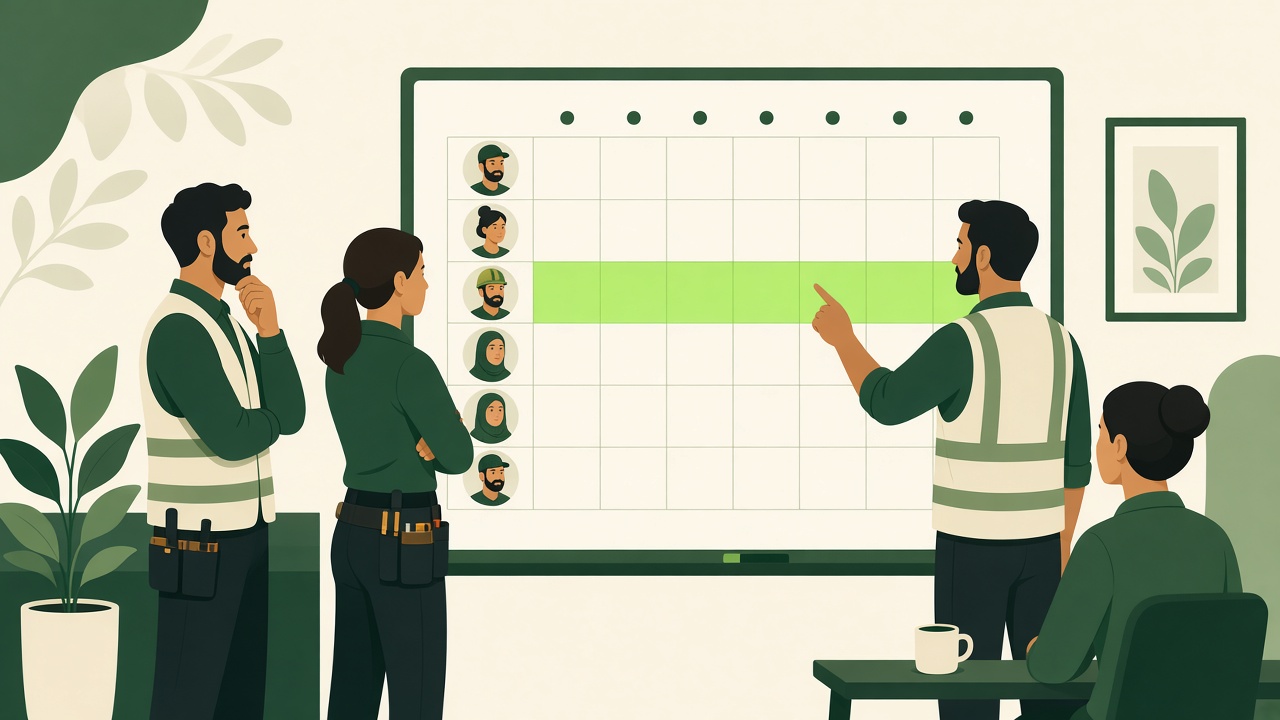
- Assign ownership. Every stage has one name next to it.
- Build the process. Written steps for response, follow-up, reminders and estimates.
- Review the scorecard. A short weekly meeting, the same numbers, the same order.
- Fix the bottleneck. One stage at a time.
- Document what works. Turn every fix into a written process so it survives staff changes.
A CRM makes this easier because stages, timestamps and sources get logged automatically. But a shared spreadsheet beats no tracking at all.
FAQ
What are the stages of a contractor sales funnel?
Traffic, lead, qualified lead, scheduled appointment, appointment ran, and closed and won. Some companies add "estimate delivered" between ran and won for longer sales cycles.
How do I calculate funnel conversion rates?
Divide each stage by the one before it. For example, show rate = appointments ran ÷ appointments scheduled.
What's a good close rate for contractors?
It depends on trade, ticket size and lead source, and published "benchmarks" vary widely. Track your own close rate by lead source and work to improve it month over month.
What is ROAS and how do I calculate it?
Return on ad spend. Divide revenue from closed jobs by ad spend. Use revenue from jobs you can trace to those ads, not total company revenue.
Should I fix lead volume or conversion first?
Check conversion first. If leads are slipping at booking or show, more leads just add more waste. Fix the leak, then scale spend.
How often should I review my funnel?
Weekly for the counts and rates, and monthly for cost per job and ROAS by lead source.
Find your bottleneck in one call
Not sure which stage is costing you jobs? Book a free growth call. We'll walk through your numbers from lead to closed job, find the biggest leak, and tell you what to fix first. No obligation, no generic pitch.